
 SPONSORED PARTNERMEXCExplore global spot and futures marketsEXPLORE MEXC →
 CHARTING PARTNERTradingViewAdvanced charts, indicators and market analysisOPEN CHARTS →
 TRADING PARTNERGMX via NetNapz TradeTrade decentralised perpetual marketsSTART TRADING →
Analyst Note: XRP Volume Profile Points to Liquidity Gap Below
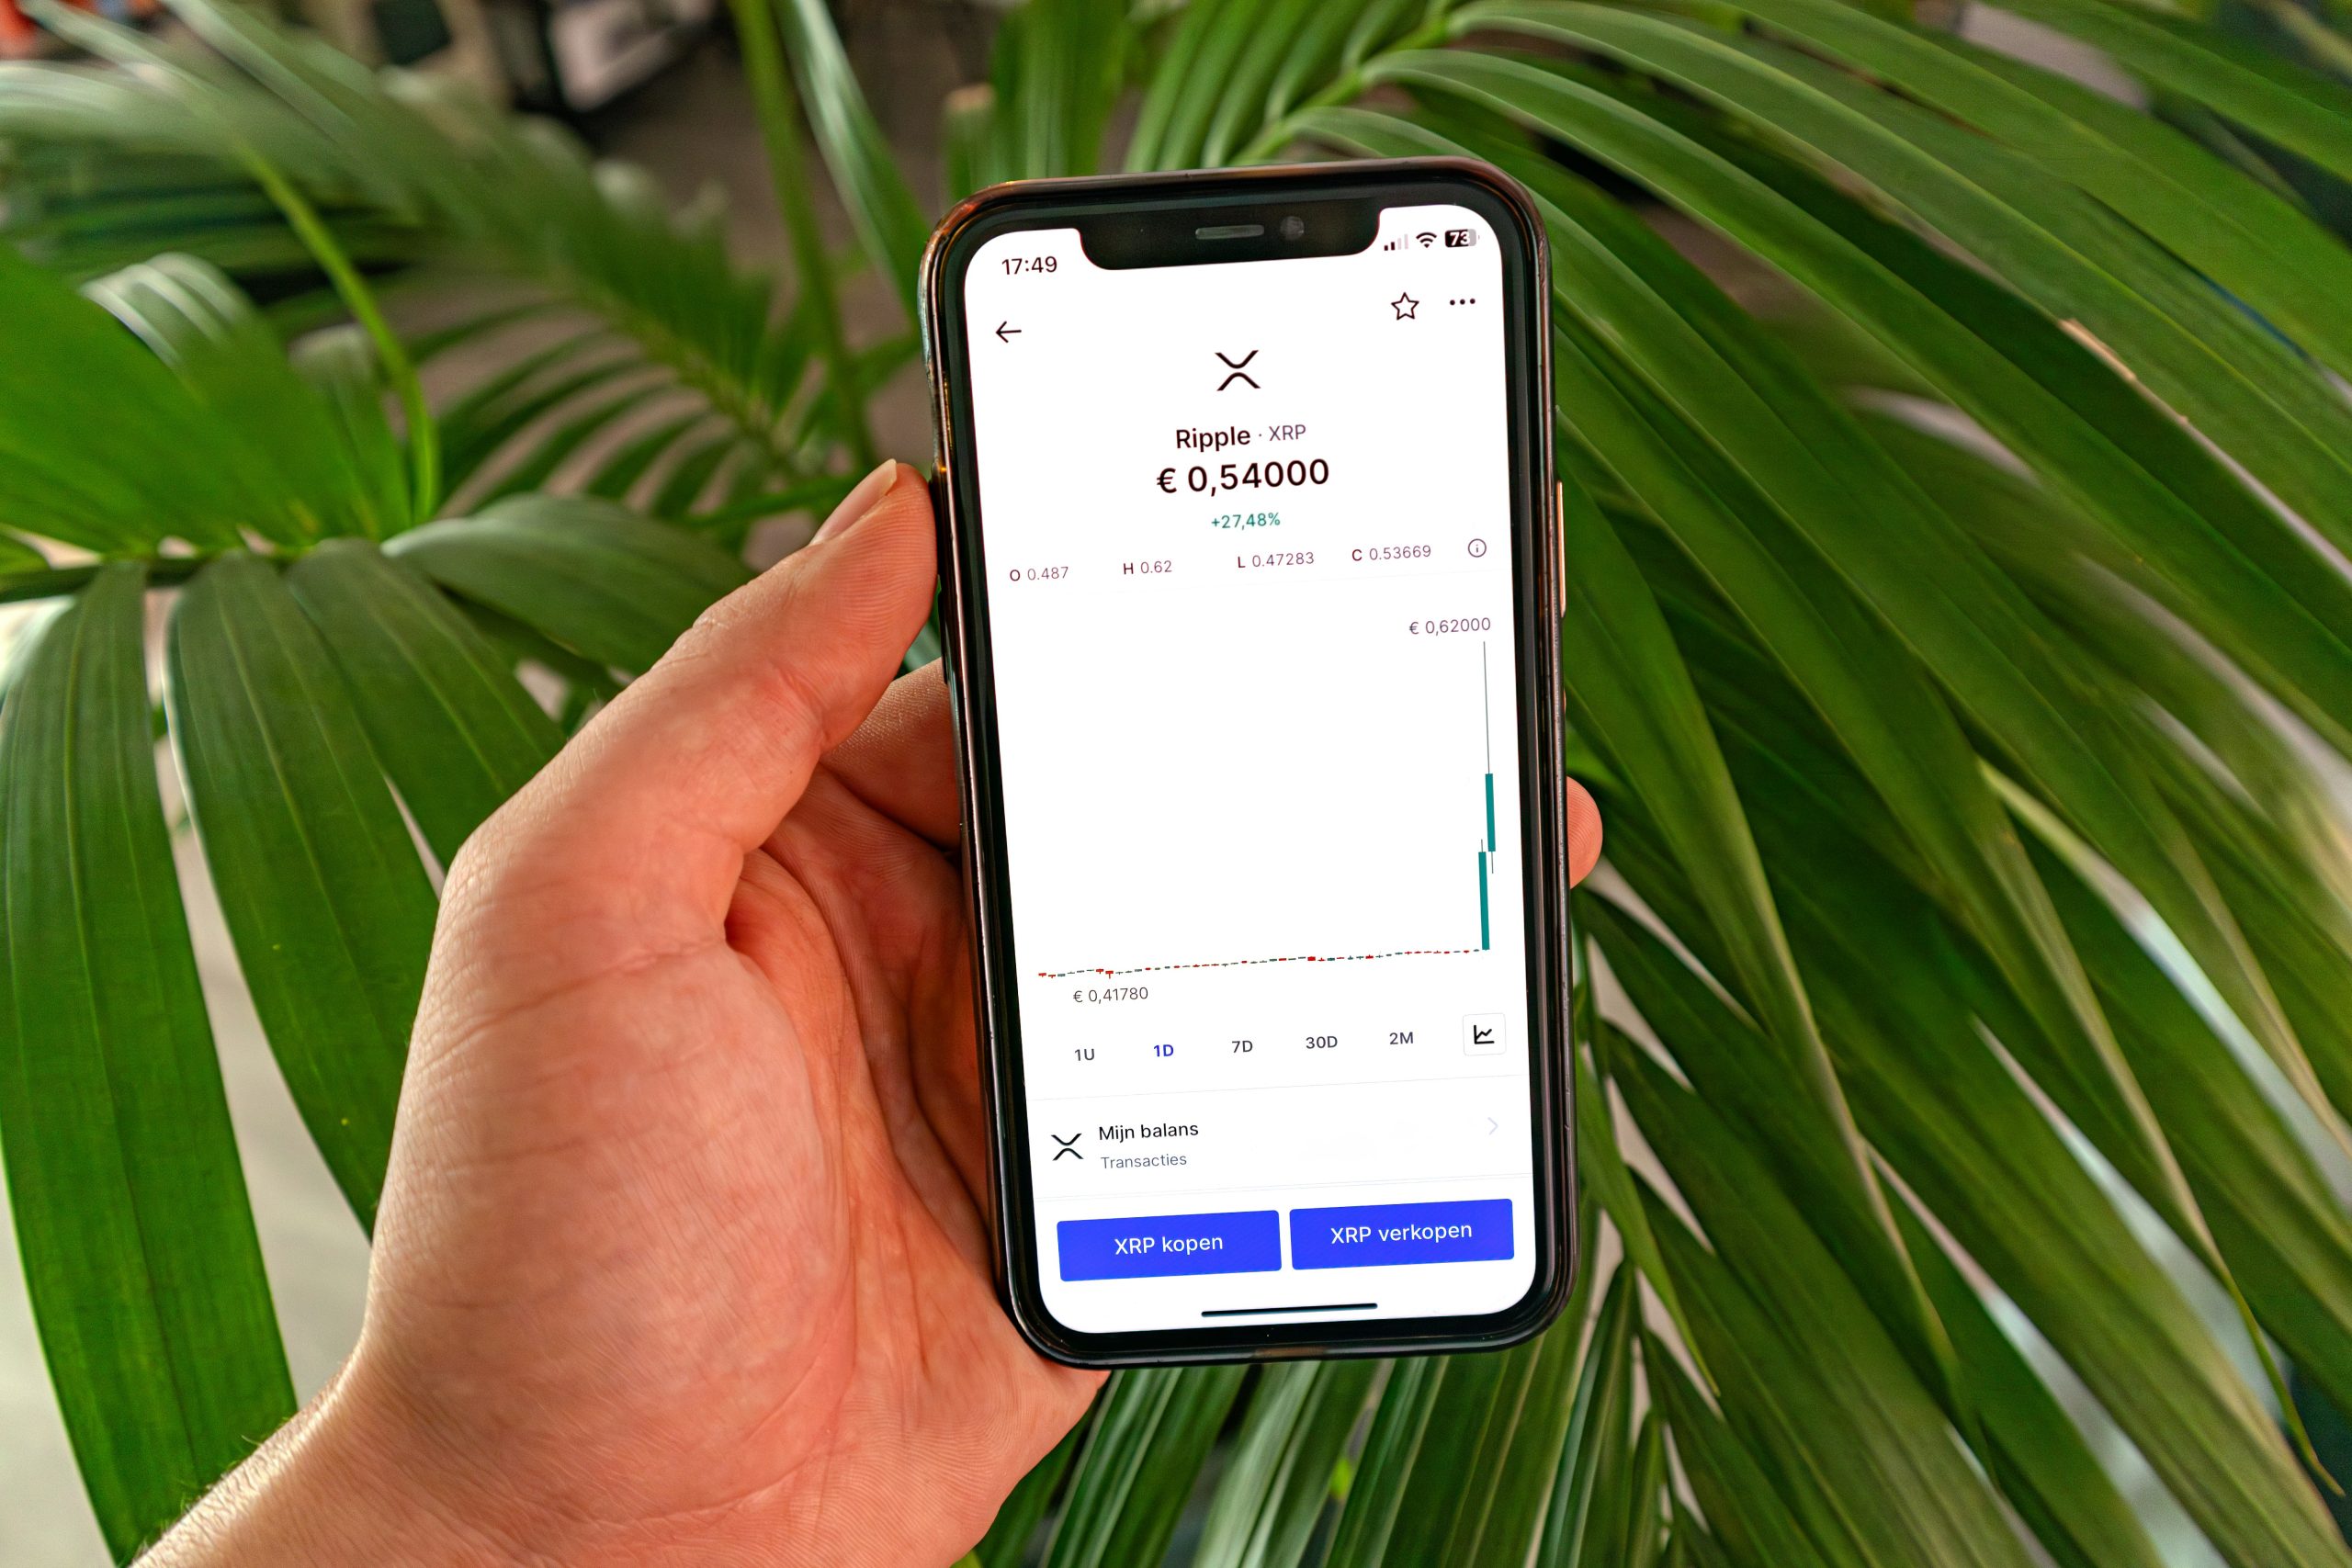
Volume profile analysis on XRP shows a thin liquidity zone just beneath current price, an area where relatively few trades have historically occurred. Thin zones like this can see faster price movement if broken, since fewer resting orders slow the decline.
Above current price, a high-volume node has acted as resistance on several recent attempts. Traders watching this setup will be looking for either a clean breakout above that node or a swift move through the liquidity gap below as the next directional signal.
This is technical commentary for informational purposes only, not personalized financial advice. See our Risk Disclaimer.
NetNapz assessment
A low-volume price zone can allow XRP to move quickly once price enters it, but volume-profile gaps are not guarantees. They are better treated as areas where there may be less historical trading interest, which can increase speed and volatility if support fails.
What to watch next
Watch whether the edge of the low-volume area acts as support, how spot volume behaves on a test and whether derivatives positioning becomes crowded. A fast move through the gap followed by immediate recovery would carry a different message from sustained acceptance at lower prices.
What a volume-profile liquidity gap means
Volume profile shows where trading activity has historically concentrated at different price levels. A thin zone means relatively little business was done there, so the market may have fewer established buyers or sellers to slow a move. If price enters that area, it can travel quickly until it reaches the next region where more volume previously changed hands.
Why gaps are not guaranteed targets
A low-volume area is not a prediction that price must move through it. New information can create fresh demand or supply at levels that were previously quiet. The profile is best used as a map of where liquidity may be thinner rather than as a certainty.
How traders can combine the profile with price action
Support becomes more credible when a high-volume node, prior swing level and visible buying response occur in the same area. If XRP loses a key support zone and enters a low-volume pocket on rising selling volume, the risk of a faster move increases.
Derivatives and news can accelerate the move
XRP is active in perpetual futures and can respond sharply to regulatory or ETF headlines. If a technical break occurs while leverage is crowded, liquidations can amplify movement through a thin zone. That is why open interest and funding should be checked alongside the profile.
Risk management
Traders should avoid assuming a liquidity gap will be filled to the exact dollar. Instead, define the level that invalidates the trade, identify the next high-volume area and size the position so a fast move through the gap remains manageable.
Bottom line
The volume profile highlights where XRP may have less historical trading support below price. It is most useful when combined with structure, volume and derivatives positioning. A confirmed break into the gap would raise downside risk, while strong buying before the gap could invalidate the setup entirely.